If your sales leader asked you how your sales team is doing, what data would you look at? Would it be the number of closed deals, meetings booked, calls made, or something else entirely?
While key performance indicators, or KPIs, are the best way to see how your team is doing and assess the health of your pipeline, it can be a little overwhelming with so many different KPIs and data points to look at.
To help make your job a little easier, we've identified the best sales KPIs you should be monitoring right now, as well as some tips on how to choose the right sales KPIs for your team.
Optimizing your sales funnel? Start here.
Tap into the metrics that stand between you and your revenue goals. Get our checklist of basic and advanced KPIs that best-in-class sales organizations use to measure success. Use these slides as the framework to anchor your sales team meetings, training sessions, strategic planning, forecast calls, or executive briefings.
What Are KPIs for Sales?
Sales KPIs are measurable values that show the performance of an organization, a department, or individual employees against their objectives.
The right KPIs will help you track the effectiveness of your relevant sales activities, so you can optimize your sales process overall. When used correctly, KPIs help to quantify whether a process or initiative is working or not, and if you need to pivot.
What Are Sales Metrics?
Sales metrics are categories of quantifiable data that track the status of a specific process. All sales KPIs are metrics, according to that definition. However, not all sales metrics are suitable sales KPIs.
Yes, the terms sales metrics and sales KPIs are often used interchangeably. However, the difference lies in how you use them.
How KPIs and Sales Metrics Work Together
There are countless examples of sales metrics, including social media shares, profit margins, and website traffic. But not all sales metrics will act as a compass toward a specific goal. For example, tracking social media likes could serve as a useful metric for marketing purposes, but it won't necessarily give much insight into whether you're on track with your sales goals.
With all the metrics to track, it can be difficult to figure out which ones to prioritize as KPIs. If you know how to choose the right sales KPIs, you can avoid wasting time on metrics that dont affect the bottom line.
How to Choose the Best Sales KPIs for Your Team
As a sales manager, you not only need clearly defined sales KPIs in order to boost sales, but also effective ways to monitor them. With so many different options to choose from, however, it can be difficult to determine which ones your team should focus on.
These three steps can help lead you in the right direction when choosing KPIs for your sales team.
1. Define Your Goals
The first step in choosing the right KPIs for your sales team is defining which company-wide goals you need to meet. Each goal should also have at least one secondary goal to support it. For example, if your company-wide goal is to increase annual revenue by a specific percentage, a secondary goal might be to increase revenue by a specific percentage each month. Another secondary goal could be to decrease the average sales cycle length by a specific percentage.
Its also important to keep the sales landscape related to your specific industry in mind while defining sales goals. The impact of the pandemic has altered the B2B sales landscape, forcing organizations to embrace digital transformation to stay competitive. In fact, 80% of B2B sales interactions are expected to occur in digital channels by the year 2025. As the sales landscape becomes more buyer-centric, sales managers should keep sales goals in mind that accelerate revenue and reflect the buyers expectations in todays digital landscape.
2. Identify What Needs to Happen to Reach Each Goal
Once you broadly define your primary and secondary goals, its time to specify what needs to happen in order to meet each goal. Communication is vital during this step. Work with marketing to make sure you're both aligned toward the same objectives. When sales and marketing are on the same page, sales cycles are shorter and sales costs decrease.
It may be easier to work backward when identifying what actions need to happen in order to meet your main goals. If a goal is to hit a specific revenue amount, ask yourself how many deals your team needs to close so you can reach that amount. Then, in order to close that number of deals, how many sales opportunities do you need in your pipeline? Lastly, how many meetings with prospects does your sales team need to have per week and month in order to acquire those opportunities?
Taking time to identify those actions helps you determine which KPIs will best measure your teams progress.
3. Decide How to Prioritize Your KPIs
After choosing your goals and identifying what actions to measure, its time to choose how to measure your progress. In other words, its time to prioritize your KPIs. Choose the metrics that will offer the best insight as to how each goal is progressing. Then choose those as your main KPIs. Those will be the KPIs you assess on a regular basis to gain insight as to whether you're meeting your objectives.
Some KPIs will be more obvious than others. If you're struggling to choose the right ones, ask yourself whether each metric will tell you what to do next if you're not meeting your goal. For example, if you haven't hit your monthly revenue goal, you should be able to assess the secondary actions assigned to that goal to see what to do next. Getting to the bottom of it is easier when you have a clearly defined set of secondary metrics associated with each KPI.
The Top 8 Sales KPIs to Consider
These are the top sales KPIs used by modern sales teams. Keep in mind, however, that your final selection should reflect the unique needs of your sales team and your specific business model.
1. Number of New Leads
Without leads, you have no sales, and without a consistent flow of leads, sales forecasting is a nightmare. Thats why you need to be tracking the number of new leads your sales team is generating each month.
How you track the number of new leads will depend on your teams definition of a lead. For instance, you may determine that if somebody clicks on a certain page, or signs up for a certain webinar, then they are a qualified lead. Or, if you use lead scoring, you may determine that a certain score determines when someone becomes a lead.
Just remember, this isn't the time for vanity metrics. Dont lower your standards for a lead to make this number look better. A lead should only be considered a lead if there is a real chance of a conversion.
It may also be a good idea to track this metric per rep - as well as on a team-wide basis. This will allow you to narrow down which reps may need more support or training.
2. Leads to Meetings Conversion Rate
A consistent flow of new leads doesn't mean much unless your team can convert them into paying customers. Thats why you need to keep a close eye on your conversion rates through each step of the pipeline. One important conversion rate thats specifically applicable to outbound sales teams is the leads to meetings conversion rate.
If you're not converting leads to meetings, this KPI can clearly indicate that you're facing a roadblock in your sales pipeline. The leads to meetings conversion rate tells you how efficiently your team is converting leads that enter the sales funnel into actual meetings and moving prospects down the funnel.
To calculate your leads to meetings conversion rate, divide the number of meetings by the number of leads, then multiply that number by 100.
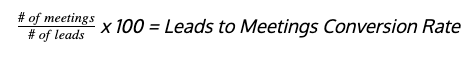
For example, if your team had 100 leads, and 6 of them turned into meetings, your leads to meetings conversion rate would be 6%.
If this number is low, it could mean several things:
- Your reps may need more training or support
- Your sales process may need more work
- Your lead qualification needs work
If you see your leads to meetings conversion rate dropping, its time to dive in and find out what is going wrong. This is another metric that may be best if tracked per-rep to make troubleshooting easier. They may simply need the help of an automated solution that simplifies the process of scheduling meetings so they can close deals faster.
3. Meetings to Pipeline Conversion Rate
The great thing about conversion rates is that they can be measured at any stage in the sales pipeline. After determining your leads to meetings conversion rate, it could be beneficial to calculate your meetings to pipeline conversion rate as well.
The meetings to pipeline conversion rate indicates the percentage of meetings that turn into deals or qualified opportunities in a sales pipeline. It is also sometimes referred to as the meetings qualified rate.
To calculate your meetings to pipeline conversion rate, divide the number of deals (or qualified opportunities) by the number of meetings, then multiply that number by 100.

For example, if your team had 60 meetings in a month, and 20 of those meetings turned into deals (or qualified opportunities), your meetings to pipeline conversion rate would be 33%.
4. Deal Win Rate
Deal win rate measures how many deals you won, divided by the total number of opportunities (AKA pipeline) created.
To calculate deal win rate, divide the number of closed, won deals in a specific time period by the number of opportunities created during that same period.
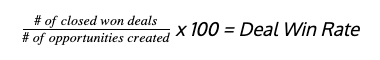
For example, if you won 10 deals in a given month, out of 100 opportunities created, your deal win rate would be 10%.
5. Average Deal Cycle (Duration) AKA Pipeline Velocity
Pipeline velocity tells you how a deal moves from prospect to close, whether it's won or lost, and identifies the sales cycle length, deal size, and win rate to tell you how much money is moving through your pipeline every day.
In truth, the specific number isn't that important, but you should identify a benchmark to judge your entire pipeline process. If your conversion rate goes down, your pipeline velocity will be negatively affected. But if your sales cycle goes up, your pipeline velocity will be positively affected.
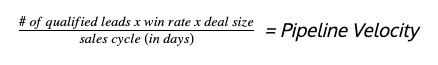
So how exactly do you calculate pipeline velocity?
This one is a little more complicated. Multiply the number of qualified opportunities, your win rate, and the average deal size together. Then divide that number by the number of days in your sales cycle.
If you could only look at one KPI, pipeline velocity would likely be the best simply because it gives you such a holistic view of the health of your sales system.
6. User Adoption of the Sold Solution
User adoption is the process of becoming acclimated to a new product or service and eventually deciding to use it as a replacement for an old product or service. Understanding peoples adoption behavior can prove helpful when identifying if it is providing value.
The adoption rate is the percentage of new users of the product or service. To calculate adoption rate, divide the number of new users during a specific time period by the total number of users during that same time period. Multiply the result by 100.
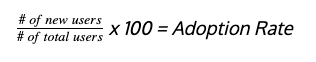
For example, if you want to calculate your adoption rate for the month, you would divide the number of users who used the sold solution for the first time that month (lets say 50) by the total number of users on the 31st of the month (lets say 500). Your adoption rate would be 10%. The higher the adoption rate, the better, since a high adoption rate shows that there is a need for your sold solution and that implementation is going smoothly.
7. Net Promoter Score (NPS)
Net Promoter Score (NPS) is used to measure customer loyalty. NPS is obtained by asking a customer, on a scale of 1-10, how likely they are to recommend a company to someone else.
Respondents who answer with a number between 0-6 are considered detractors.
Respondents who answer with 7 or 8 are considered passives.
Respondents who answer 9-10 are considered promoters.
To calculate your NPS, subtract the percentage of detractors from the percentage of promoters. Although the answer results in a percentage, NPS is always shown as a whole number.
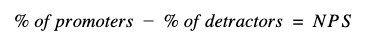
For example, if 60% of respondents were promoters and 10% of respondents were detractors, your NPS would be 50. The higher the NPS, the better.
Using NPS as a KPI allows you to identify detractors and passives, and follow up with them to see why they're not promoters. Its also a good indicator of whether you need to redefine your target audience.
8. Buyer Sentiment
Buyer sentiment - a buyer's emotional response to sales engagement - is one of the most important KPIs to measure because it can help you close deals faster, and it can indicate where to invest your sales teams efforts.
For example, if your team uses email replies as a metric, you may find that there is a high reply rate, but you wont discover why customers were motivated to respond. It could very well be that they were responding with a complaint.
You can classify email responses to assess buyer sentiment. Heres how Outreach Insights classifies email responses for users:
- Positive
- Objection
- Unsubscribe
- Referral
- Other
Monitor Your Growth With A Sales KPI Dashboard
As a sales manager, there are a lot of things that you have to keep track of. You're the captain of the ship, and you need to be watching for rocks ahead. Knowing what warning lights to keep an eye on is key to your success.
Thats what these KPIs are, warning lights that something isn't right.
With Outreach Insights, you have access to a daily sales dashboard with proprietary KPIs for tracking seller performance and coaching toward success. Our machine learning tool also helps classify buyer sentiment so you can close deals faster and focus on what matters: engaging customers.